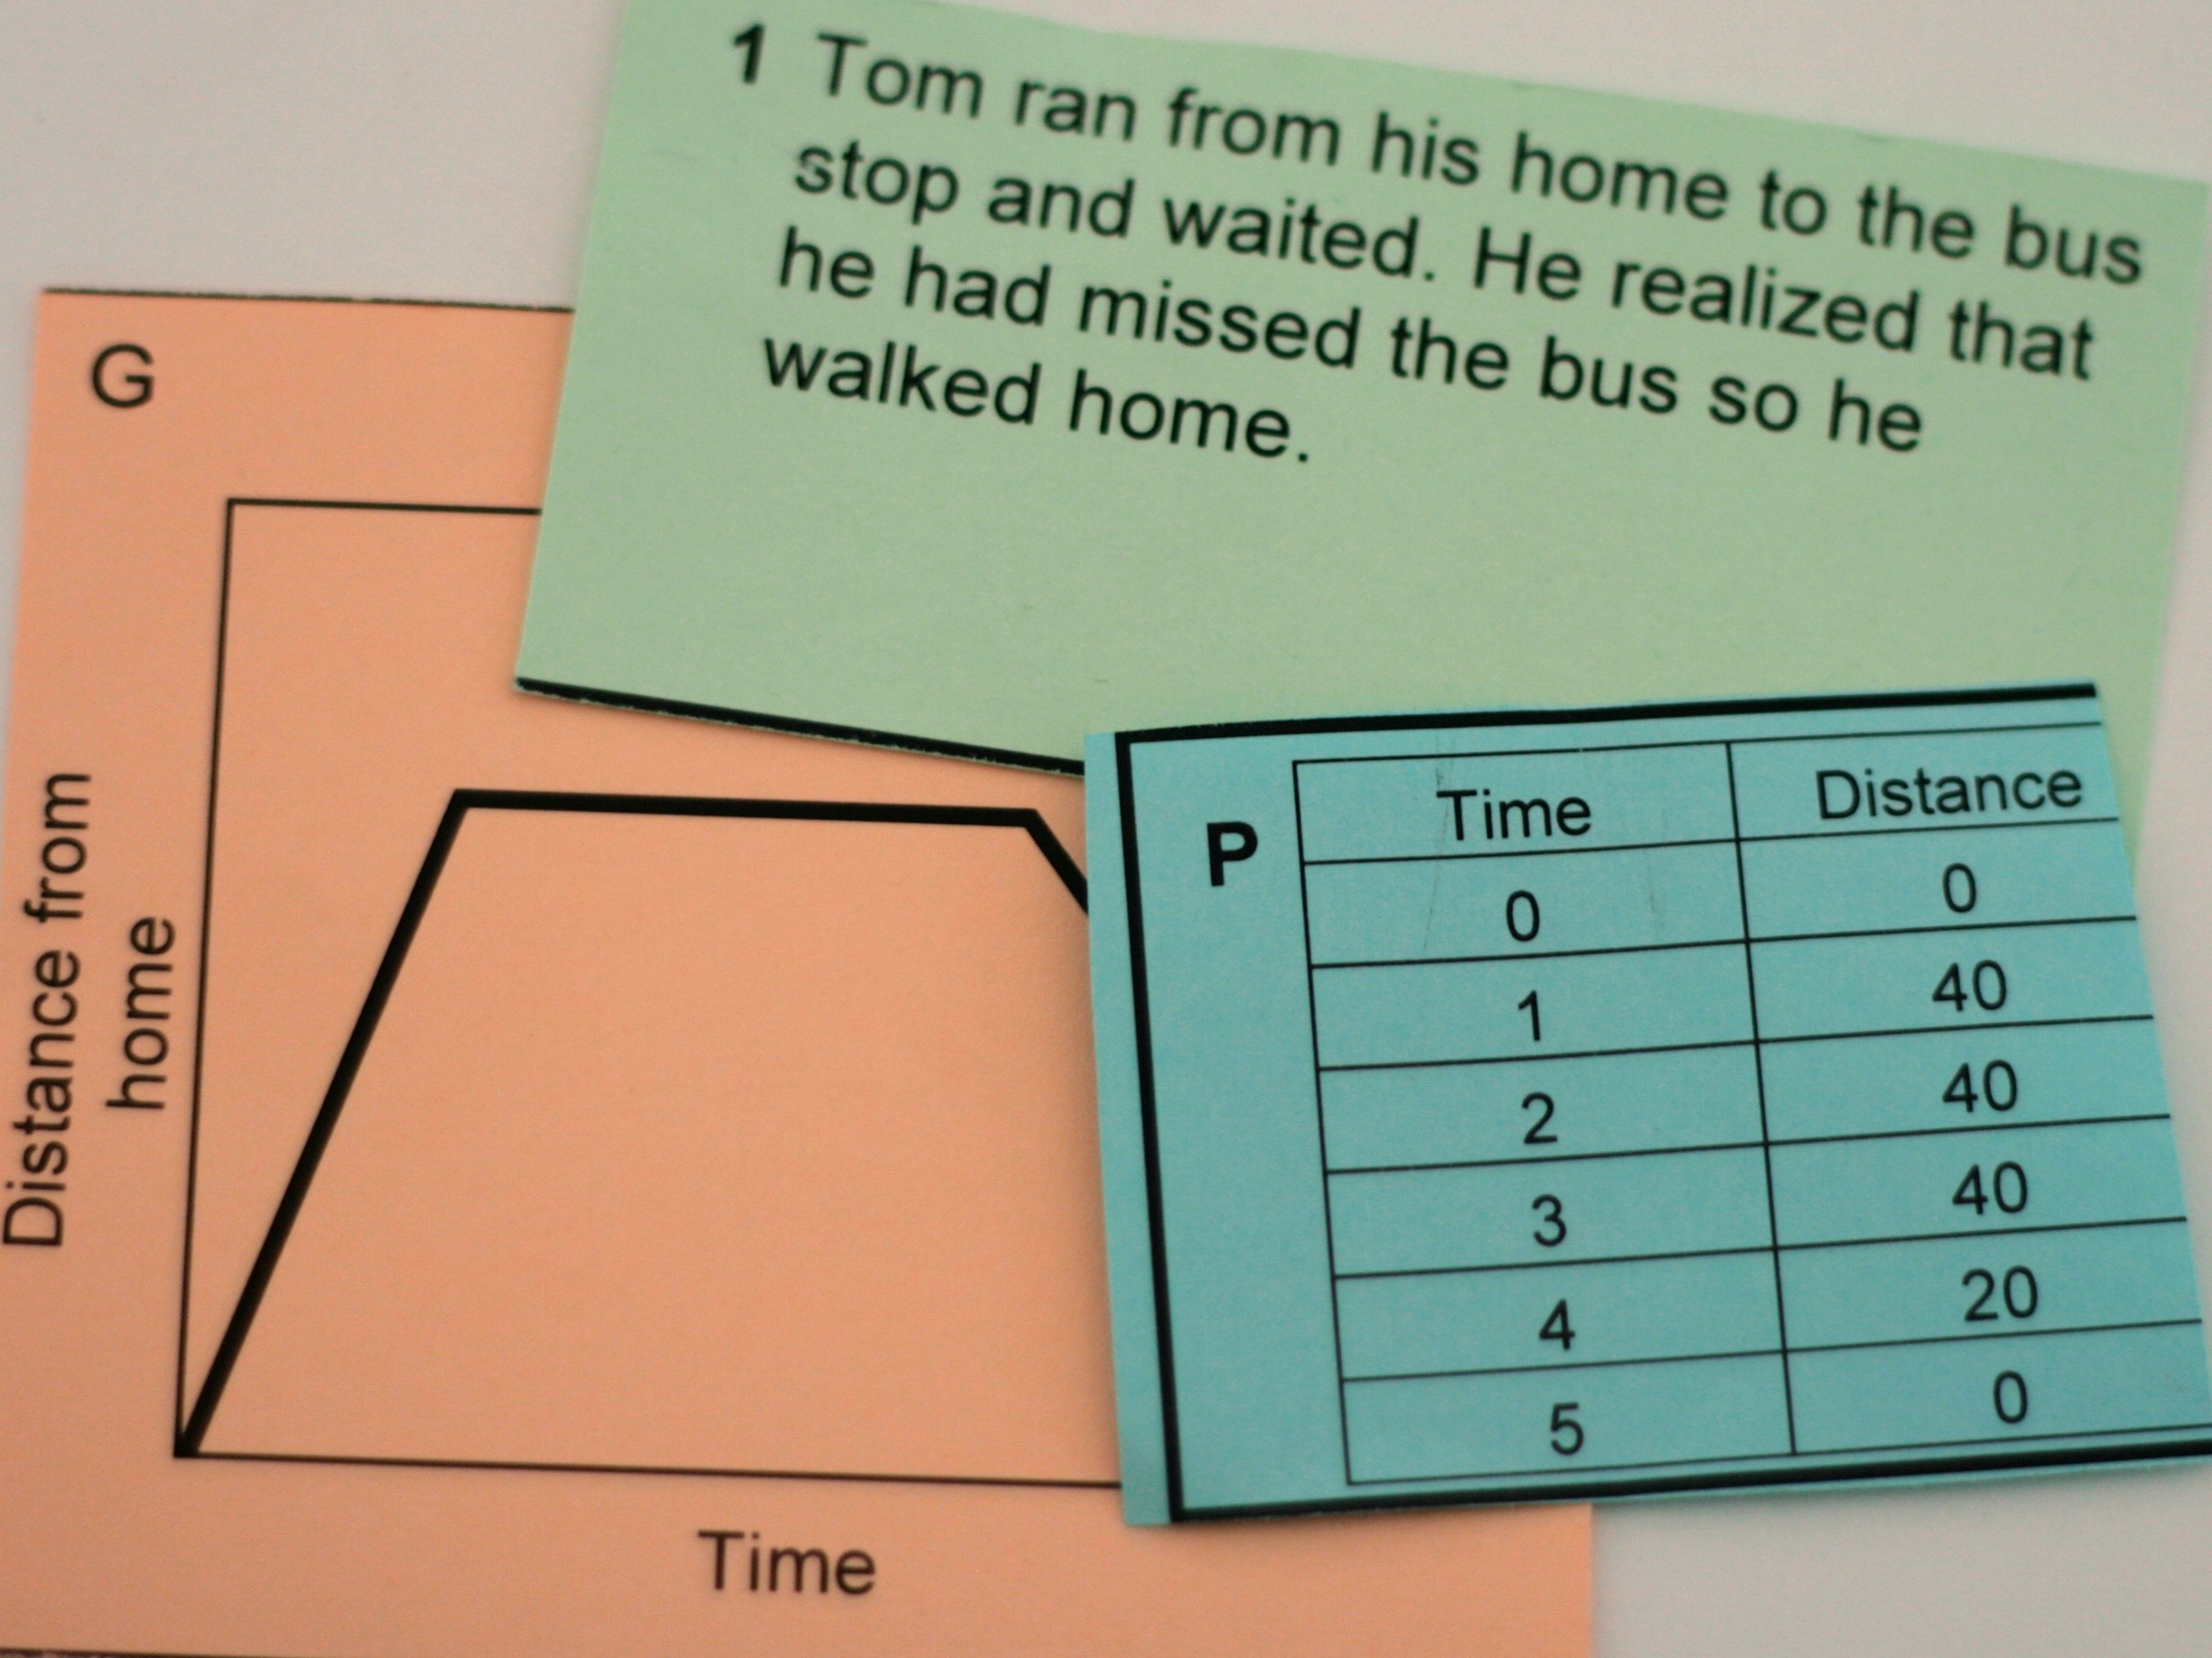
The time-distance graphs lesson involves a brief introduction supported by a PowerPoint presentation followed by a card-matching activity (see Figure 1 below). There are three sets of cards: graphs, stories and tables of data. The lesson guidance suggests that students are first given the graph and story cards to match, and once they have matched these, they compare their results with another group and, in the light of this comparison, they may want to make changes to their matches. The guidance suggests that if the lesson is to take place over two lessons, this is a good place to break.
A whole class discussion follows, supported by a PowerPoint slide with a graph and empty table, in which students make up data for the graph. They are then given the third set of cards, asked to match them with the existing pairs and possibly make changes to the existing pairs, and then to compare with another group, as before. The lesson ends with a whole-class discussion in which the teacher suggests some scenarios and students draw time-distance graphs to match the scenario on mini whiteboards.
This is a lesson written by the Mathematics Assessment Project at the university of Nottingham. The full lesson can be downloaded here: L02_Distance_Time_Beta_lesson